Introduction
This article lists some useful monitoring tools in Linux.
Tools
nmon
nmon is short for Nigel’s Monitor. Nigel Griffiths in the creator and developer for the first two decades years. This free tool gives you a huge amount of important performance information in one go.
It can output the data on screen or save the data to a comma separated file. Performance data includes:
- CPU utilization
- Memory use
- Kernel statistics and run queue
- Disks I/O rates, transfers, and read/write ratios
- File systems size and free space
- Disk adapters
- Network I/O rates, transfers, and read/write ratios
- Paging space and paging rates
- Machine details, CPU and OS specification
- Top processors
- User defined disk groups
- Asynchronous I/O - AIX only
- Workload Manager - AIX only
- ESS and other disk subsystem - AIX only
- Dynamic LPAR changes - AIX and Linux (on POWER hardware)
nomon in AIX:
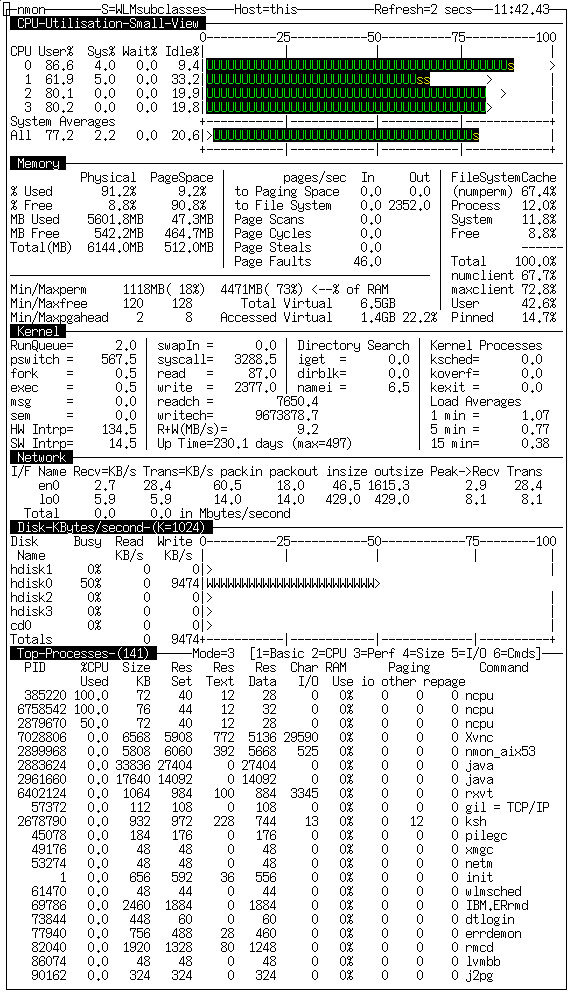
nomon in Linux:

top
The top program provides a dynamic real-time view of a running system. It can display system summary information as well as a list of processes or threads currently being managed by the Linux kernel. This is one of my favorite tools in Unix/Linux.
Some of top’s available process fields:
- PID: task’s unique process ID.
- USER: the effective username of task’s owner.
- PR: priority of the task.
- NI: Nice Value of task. A negative nice value means higher priority, whereas a positive nice value means lower priority.
- VIRT: virtual memory size (KiB). The total amount of virtual memory used by the task. It includes all code, data and shared libraries plus pages that have been swapped out and pages that have been mapped but not used.
- RES: resident memory size (KiB).
- SHR: shared memory size (KiB). A subset of resident memory (RES) that may be used by other processes.
- S: process status. S=sleeping, I=idle, R=running etc.
- %CPU: CPU usage. The task’s share of the elapsed CPU time since the last screen update, expressed as a percentage of total CPU time.
- %MEM: memory usage. A task’s currently resident share of available physical memory.
- TIME: CPU time. Total CPU time the task has used since it started.
- TIME+: CPU time, hundredths. The same as TIME, but reflecting more granularity through hundredths of a second.
- COMMAND: command name or command line.
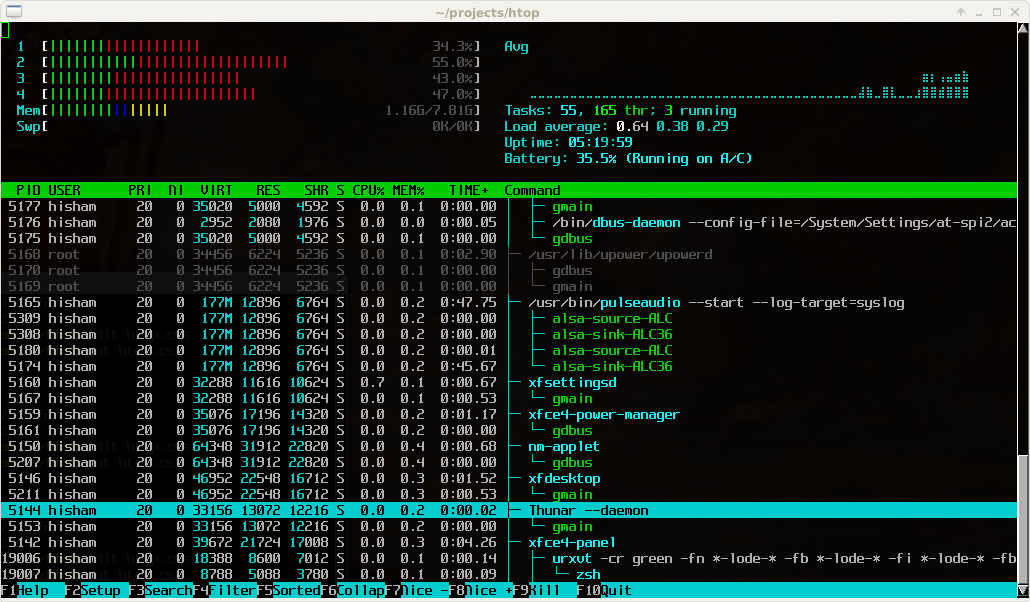
htop
The htop program is an interactive system-monitor process-viewer and process-manager. It is designed as an alternative to the Unix program top.
Nethogs
NetHogs is a small ‘net top’ tool. Instead of breaking the traffic down per protocol or per subnet, like most tools do, it groups bandwidth by process.
NetHogs does not rely on a special kernel module to be loaded. If there’s suddenly a lot of network traffic, you can fire up NetHogs and immediately see which PID is causing this. This makes it easy to identify programs that have gone wild and are suddenly taking up your bandwidth.
Since NetHogs heavily relies on /proc, most features are only available on Linux. NetHogs can be built on Mac OS X and FreeBSD, but it will only show connections, not processes.
Options:
-d : delay for refresh rate.
-h : display available commands usage.
-p : sniff in promiscious mode (not recommended).
-t : tracemode.
-V : prints Version info.

-m : Change the units displayed for the bandwidth in units like KB/sec -> KB -> B-> MB.
-r : Sort by magnitude of respectively traffic.
-s : Sort by magnitude of sent traffic.
-q : Hit quit to the shell prompt.
Performance data information:
- send: the amount of sending traffic being used by one process.
- received: the amount of receiving traffic being used by one process.
iotop
iotop is a Python program with a top like UI used to show of behalf of which process is the I/O going on. It requires Python ≥ 2.7 and a Linux kernel ≥ 2.6.20 with the TASK_DELAY_ACCT CONFIG_TASKSTATS, TASK_IO_ACCOUNTING and CONFIG_VM_EVENT_COUNTERS options on.
iotop displays columns for the I/O bandwidth read and written by each process/thread during the sampling period. It also displays the percentage of time the thread/process spent while swapping in and while waiting on I/O. For each process, its I/O priority (class/level) is shown.
Options:
-o, --only Only show processes or threads actually doing I/O, instead of showing all processes or threads. This can be dynamically toggled by pressing o.

-b, --batch Turn on non-interactive mode.  Useful for logging I/O usage over time.

-n NUM, --iter=NUM Set the number of iterations before quitting (never quit by default).  This is most useful in non-interactive mode.

-d SEC, --delay=SEC Set the delay between iterations in seconds (1 second by default).  Accepts non-integer values such as 1.1 seconds.

-p PID, --pid=PID A list of processes/threads to monitor (all by default).

-u USER, --user=USER A list of users to monitor (all by default)

-P, --processes Only show processes. Normally iotop shows all threads.
Performance data information:
- Total DISK READ: total read bandwidth between processes and kernel threads.
- Total DISK WRITE: total write bandwidth between processes and kernel threads.
- Current DISK READ: read bandwidths for current disk I/O between kernel block device subsystem and underlying hardware (HDD, SSD, etc.).
- Current DISK WRITE: write bandwidths similar to DISK READ.

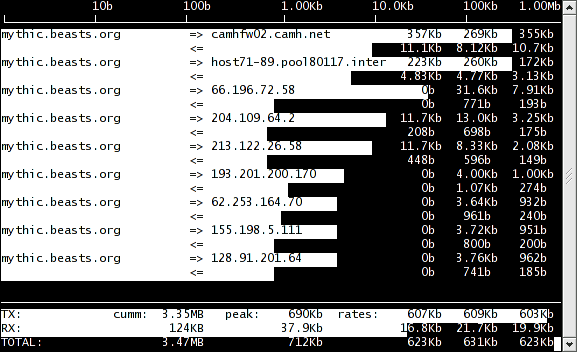
iftop
iftop does for network usage what top(1) does for CPU usage. It listens to network traffic on a named interface and displays a table of current bandwidth usage by pairs of hosts.
iftop must be run as root. It depends on two libraries: libpcap and libncurses.
Information at the bottom:
- TX: sending traffic
- RX: receiving traffic
- Cumm: total traffic from starting
- peak: the highest values of each traffic
- rates: the average traffic in the last 2s, 10s and 40s
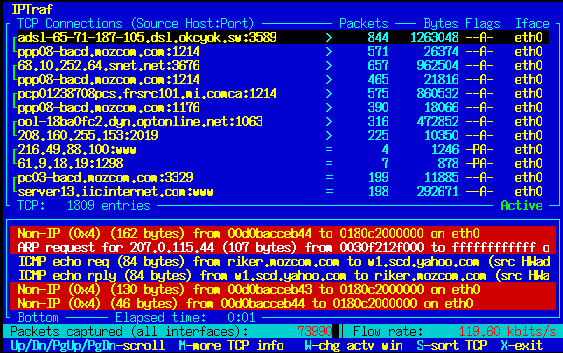
IPTraf
IPTraf is a console-based network statistics utility for Linux. It gathers a variety of figures such as TCP connection packet and byte counts, interface statistics and activity indicators, TCP/UDP traffic breakdowns, and LAN station packet and byte counts.
Features:
- An IP traffic monitor that shows information on the IP traffic passing over your network. Includes TCP flag information, packet and byte counts, ICMP details, OSPF packet types.
- General and detailed interface statistics showing IP, TCP, UDP, ICMP, non-IP and other IP packet counts, IP checksum errors, interface activity, packet size counts.
- A TCP and UDP service monitor showing counts of incoming and outgoing packets for common TCP and UDP application ports
- A LAN statistics module that discovers active hosts and shows statistics showing the data activity on them
- TCP, UDP, and other protocol display filters, allowing you to view only traffic you’re interested in.
- Supports Ethernet, FDDI, ISDN, SLIP, PPP, and loopback interface types.
- Utilizes the built-in raw socket interface of the Linux kernel, allowing it to be used over a wide range of supported network cards.
Summary
This is just a note for myself. If you want to know more about these tools, search them on their official website. I bet you will like them.
Of course, there are many other helpful tools like:
- IOZone
- MultiTail
- Fail2ban
- Tmux
- Agedu
- NMap
- Httperf
- VmStat
- Lsof
- Tcpdump
- Iostat
- Psacct or Acct
- Monit
- Monitorix
- Arpwatch
- Suricata
- Nagios
- Collectl
It is easy to find their manual documentations. I am not introducing them in details here.
References
- Original nmon web page in IBM
- nmon for Linux
- top(1) — Linux manual page
- mkerrisk/man-pages on GitHub
- htop - an interactive process viewer
- Nethogs on GitHub
- Iotop’s homepage
- iotop(8) — Linux manual page
- iftop: display bandwidth usage on an interface
- iftop(8) - Linux man page
- IPTraf - An IP Network Monitor
- iptraf(8) - Linux man page
blog comments powered by Disqus